Electrical | GS-MPPT-60M-200V | GS-MPPT-80M-200V | GS-MPPT-100M-200V |
|---|---|---|---|
Maximum Battery Charge Current | 60 Amps | 80 Amps | 100 Amps |
Maximum Input Voltage (Voc) | ALL: 200 Volts | ||
MPPT Operating Voltage Range | ALL: > battery voltage + 1 Volt; < 180 Volts | ||
Max. Input Current (Imp/Isc) | 56/60 Amps | 75/80 Amps | 94/100 Amps |
Nominal Operating Voltage | Amps ALL: 12-24-48 VDC | ||
Battery Voltage Range | ALL: 9-72V (charging); 10-72V (load); Power OFF < 8V | ||
Maximum Load Current | 30 Amps | 30 Amps | 30 Amps |
Maximum Self-consumption | < 2.4 Watts (12/24V); < 3.2 Watts (48V) | ||
Grounding Leg | ALL: Negative (pos. ground compatible with array float) | ||
Real Time Clock (RTC) | ALL: With coin cell (CR-2032) | ||
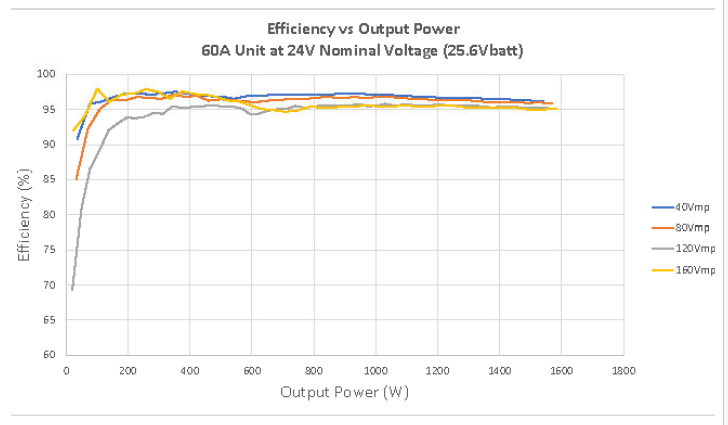
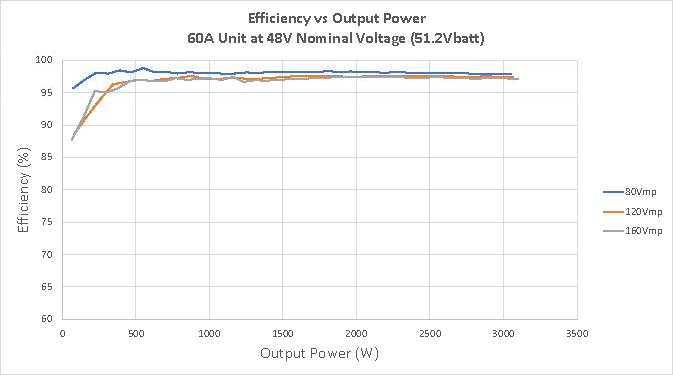
Peak Efficiency | ALL: 99% | ||
Transient Surge Protection | ALL: 4500 Watts/port | ||
Nominal Maximum Output Power (Watts) | 12, 24, 48 Volts 800, 1600, 3200 | 12, 24, 48 Volts 1064, 2128, 4256 | 12, 24, 48 Volts 1330, 2660, 5320 |
Mechanical | |||
Dimensions (cm/in) | 36.4/14.3 (H) x 22.2/8.7 (W) x 17.0/6.7 (D) | ||
Weight (lb/kg) | 14.625 / 6.63 | 15.625 / 7.09 | 16.4375 / 7.46 |
Wire Size Range: | |||
Battery and PV input terminals | 10 - 53.5 mm2 / #8 - 1/0 AWG | ||
Load terminals | 2.5 - 13.3 mm2 / #14 - 6 AWG (EXCEPT fine-stranded #6) | ||
Equip. grounding terminals | 2.5 - 33.6 mm2 / #14 - 2 AWG | ||
Battery voltage sense and RTS | 0.25 - 1.0 mm2 / #24 - 16 AWG | ||
Maximum torque: | |||
Battery and PV input terminals | 100 in-lb / 11.3 N-m | ||
Load terminals | 35 in-lb / 3.9 N-m | ||
Equip. grounding terminals | 50 in-lb / 5.65 N-m | ||
Battery voltage sense and RTS | 5 in-lb / 0.565 N-m | ||
Enclosure | IP20, Type 1 | ||
Battery Charging | |||
4-stage Charging | Bulk, Absorption, Float, Equalization | ||
Temperature compensation | -30mV/12 Volt/ºC | ||
Coefficient | Shared for Lead-acid presets; disabled by default for Lithium presets) | ||
Temperature-compensated set-points | (Absorption, Float, Equalize, HVD, HVDR (solar) | ||
Communication-Interfaces: | GENSTAR MPPT - all models |
|---|---|
SD Card | Yes (8 GB included) |
USB-C for data | Yes |
RS-232 Port | Yes |
EIA-485 Port | Yes |
Ethernet/RJ-45 Port | Yes |
Controller Area Network (CAN) | Yes |
Bluetooth Low Power | Yes |
Supported Protocols | Modbus, ModbusIP, HTTP, SNMP v2c, Bluetooth LE |
Datalogging Capacity & Capability | Internal (LiveView): 3 to 4 years daily records; 35,000 to 140,000 events (event frequency can vary greatly) Nearly infinite with 8 GB SD card (datafiles only) |
Local Display: | |
Digital Meter: | |
Resolution | 128 x 64 |
Viewing Area | 70mm x 40mm |
Display Color Backlight | Blue on white |
Operating Temperature | -20°C to +60°C |
Storage Temperature | -50°C to +80°C |
Environmental: | |
Maximum Operating Altitude | 3000 meters |
Ambient Operating Temperature Range | -30°C to +60°C (current may de-rate above 45°C)1 |
Storage Temperature | -50°C to +80°C |
Humidity | 100% n.c. |
Tropicalization | Conformally coated PCBs; |
Marine-rated terminals | |
Protections: | |
Reverse night | Battery removal |
Power-up against any active faults | Low temp foldback |
Reverse polarity - array | High temp. foldback |
Solar short-circuit | Solar high voltage |
Solar overload | Load over-current |
High heatsink temperature - current de-rating | Heatsink temperature Limit |
High heatsink temperature - load disconnect | High voltage (solar, battery, load) |
Load short-circuit | Short-circuit |
1 Thermal performance depends on the model and system parameters. See operating manual and Heat Dissipation of GenStar MPPT Controllers Inside Enclosures white paper for further performance characteristic data and information.
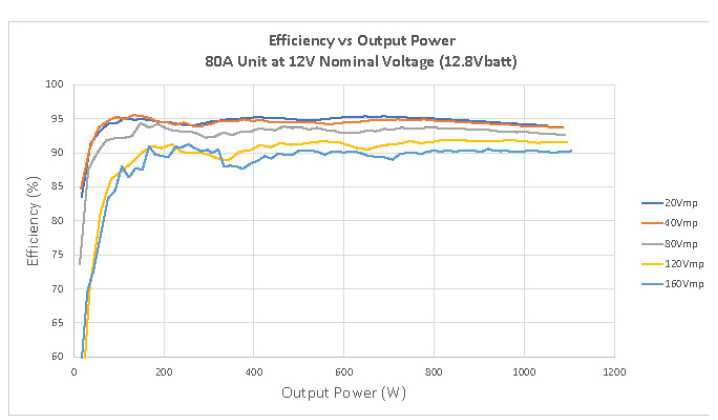
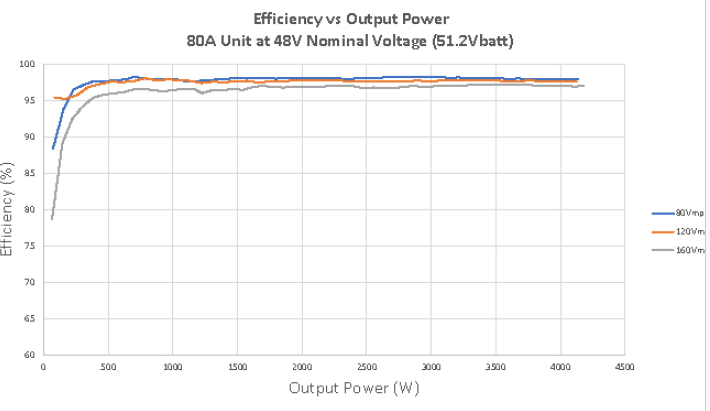
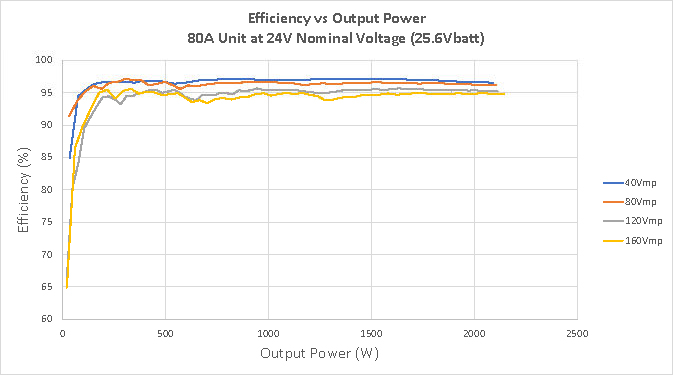
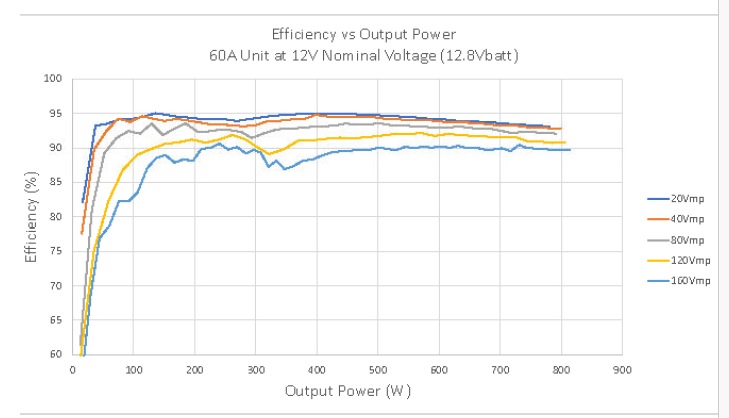
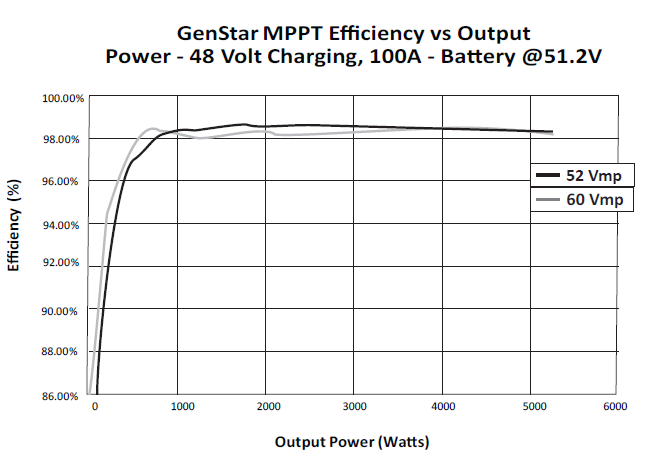
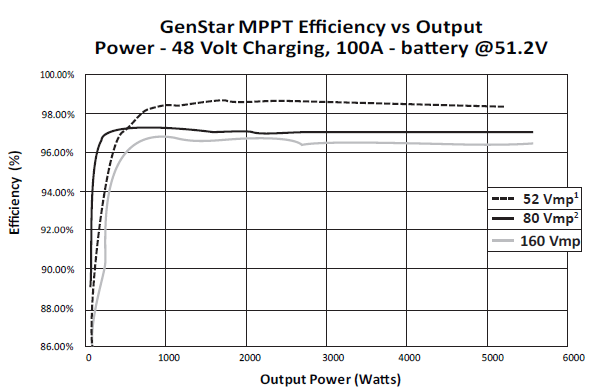
Efficiency Graphs
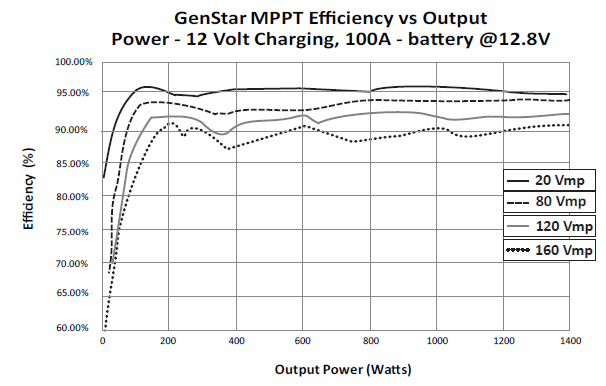
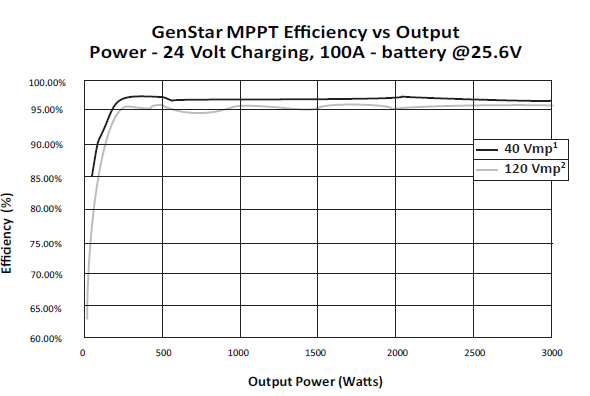
NOTES:
1 80 Vmp curve is very close to 40 Vmp, but most power points are slightly less efficient.
2 160 Vmp curve is very close to 120 Vmp, but most power points are slightly less efficient.
NOTES:
1 60 Vmp curve is very close to 52 Vmp, but most power points are slightly less efficient.
2 120 Vmp curve is very close to 80 Vmp, but most power points are slightly less efficient.